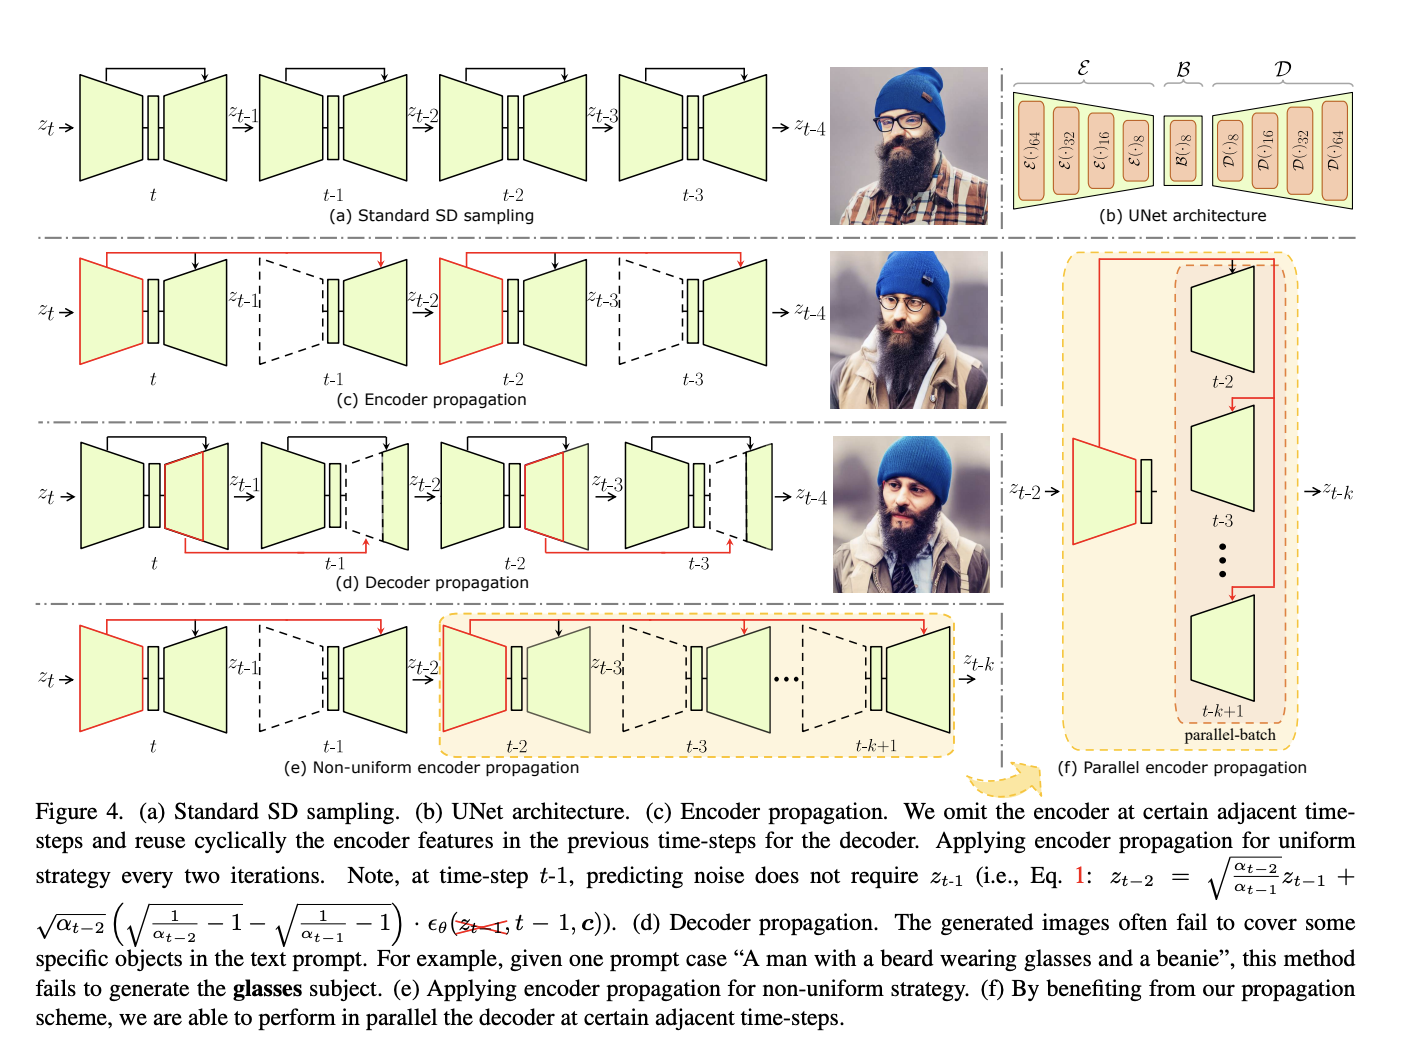
Diffusion models represent a cutting-edge approach to image generation, offering a dynamic framework for capturing temporal changes in data. The UNet encoder within diffusion models has recently been under intense…
GENERATIVE AI A step-by-step tutorial on query SQL databases with human language Image by the author (generated via Midjourney)Many businesses have a lot of proprietary data stored in their databases.…
Order capture is the process of receiving, validating, and recording customer orders from across channels to facilitate efficient fulfillment. A smoother capture process often means a faster order-to-cash cycle, fewer…
Image Generated by DALL-E 2
Text analysis tasks have been around for some time as the needs are always there. Research has come a long way, from simple…
Addressing the challenge of efficient and controllable image synthesis, the Alibaba research team introduces a novel framework in their recent paper. The central problem revolves around the need for a…
Researchers are on a quest to develop enzymes that can break down plastics so they can be 100% recycled The world produces about 400 million tonnes of plastic waste each…
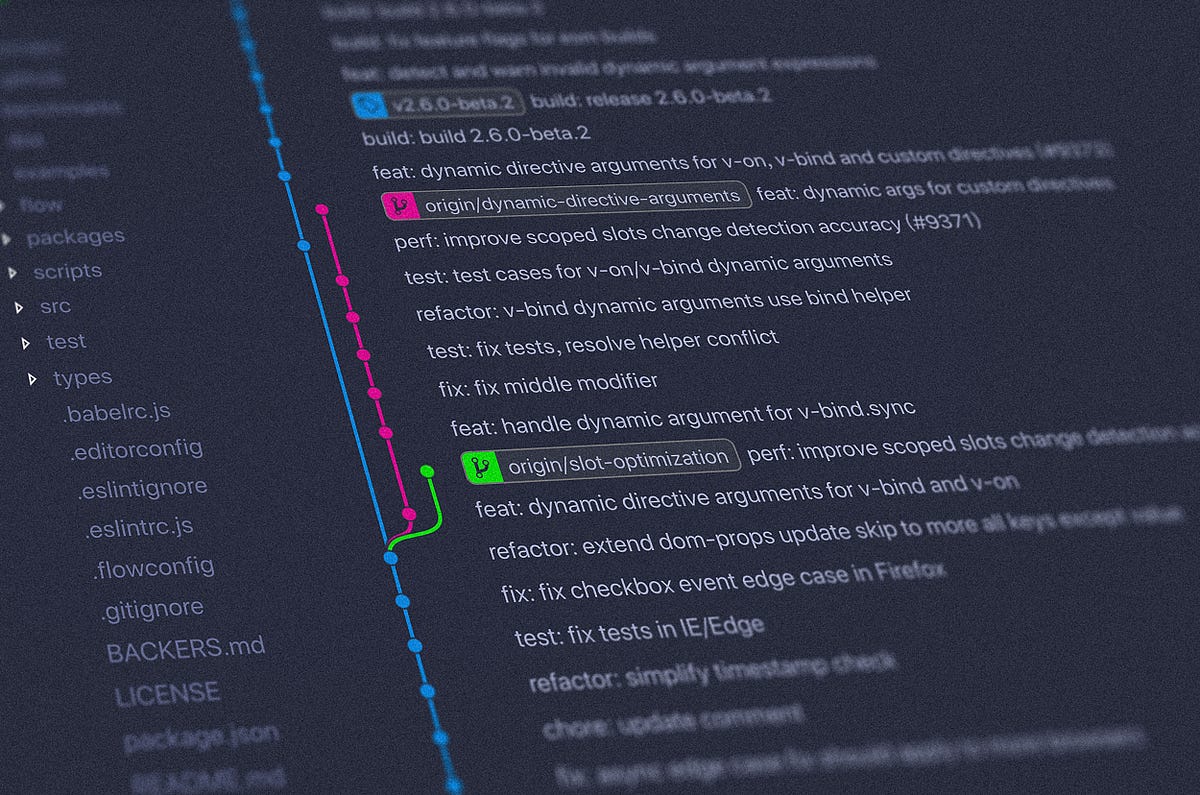
Photo by Yancy Min on UnsplashA hands-on guide for adding a motivational GitHub action to your repository I’ll start with a confession: as a software engineer, I hated and avoided…
Image by Editor
Tired of applying to data science roles and not hearing back from companies? Perhaps you managed to land a couple of interviews but weren't able…
With the recent introduction of Large Language Models (LLMs), the field of Artificial Intelligence (AI) has significantly outshined. Though these models have successfully demonstrated incredible performance in tasks like content…