
Image by Pexels
Machine Learning (ML for short) is not just about making predictions. There are other unsupervised processes, among which clustering stands out. This article introduces clustering and cluster analysis, highlighting the potential of cluster analysis for segmenting, analyzing, and gaining insights from groups of similar data
What is Clustering?
In simple terms, clustering is a synonym for grouping together similar data items. This could be like organizing and placing similar fruits and vegetables close to each other in a grocery store.
Let’s elaborate on this concept further: clustering is a form of unsupervised learning task: a broad family of machine learning approaches where data are assumed to be unlabeled or uncategorized a priori, and the aim is to discover patterns or insights underlying them. Specifically, the purpose of clustering is to discover groups of data observations with similar characteristics or properties.
This is where clustering is positioned within the spectrum of ML techniques:

To better grasp the notion of clustering, think about finding segments of customers in a supermarket with similar shopping behavior, or grouping a large body of products in an e-commerce portal into categories or similar items. These are common examples of real-world scenarios involving clustering processes.
Common clustering techniques
There exist various methods for clustering data. Three of the most popular families of methods are:
- Iterative clustering: these algorithms iteratively assign (and sometimes reassign) data points to their respective clusters until they converge towards a “good enough” solution. The most popular iterative clustering algorithm is k-means, which iterates by assigning data points to clusters defined by representative points (cluster centroids) and gradually updates these centroids until convergence is achieved.
- Hierarchical clustering: as their name suggests, these algorithms build a hierarchical tree-based structure using a top-down approach (splitting the set of data points until having a desired number of subgroups) or a bottom-up approach (gradually merging similar data points like bubbles into larger and larger groups). AHC (Agglomerative Hierarchical Clustering) is a common example of a bottom-up hierarchical clustering algorithm.
- Density-based clustering: these methods identify areas of high density of data points to form clusters. DBSCAN (Density-Based Spatial Clustering of Applications with Noise) is a popular algorithm under this category.
Are Clustering and Cluster Analysis the Same?
The burning question at this point might be: do clustering and clustering analysis refer to the same concept?
No doubt both are very closely related, but they are not the same, and there are subtle differences between them.
- Clustering is the process of grouping similar data so that any two objects in the same group or cluster are more similar to each other than any two objects in different groups.
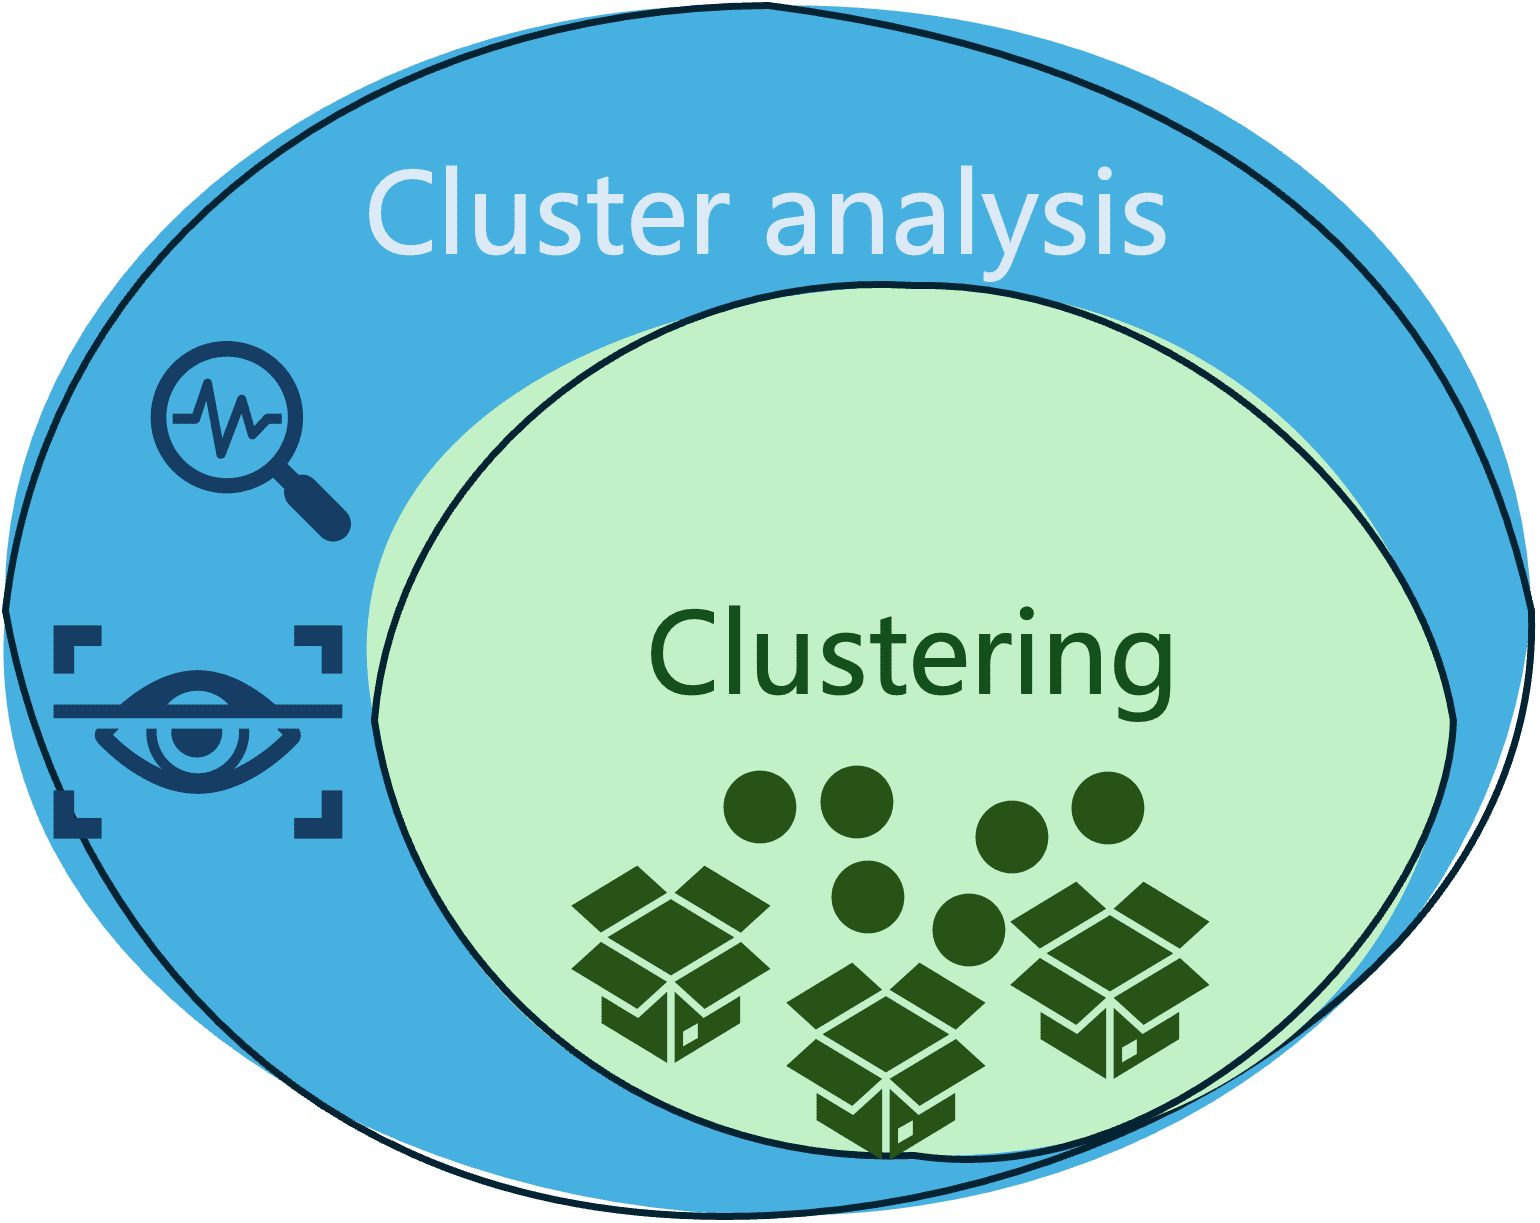
- Meanwhile, cluster analysis is a broader term that includes not only the process of grouping (clustering) data, but also the analysis, evaluation, and interpretation of clusters obtained, under a specific domain context.
The following diagram illustrates the difference and relationship between these two commonly mixed-up terms.
Practical Example
Let’s focus from now on cluster analysis, by illustrating a practical example that:
- Segments a set of data.
- Analyze the segments obtained
NOTE: the accompanying code in this example assumes some familiarity with the basics of Python language and libraries like sklearn (for training clustering models), pandas (for data wrangling), and matplotlib (for data visualization).
We will illustrate cluster analysis on the Palmer Archipelago Penguins dataset, which contains data observations about penguin specimens classified into three different species: Adelie, Gentoo, and Chinstrap. This dataset is quite popular for training classification models, but it also has a lot to say in terms of finding data clusters in it. All we have to do after loading the dataset file is assume the ‘species’ class attribute is unknown.
import pandas as pd
penguins = pd.read_csv('penguins_size.csv').dropna()
X = penguins.drop('species', axis=1)
We will also drop two categorical features from the dataset which describe the penguin’s gender and the island where this specimen was observed, leaving the rest of the numerical features. We also store the known labels (species) in a separate variable y: they will be handy later on to compare clusters obtained against the actual penguins’ classification in the dataset.
X = X.drop(['island', 'sex'], axis=1)
y = penguins.species.astype("category").cat.codes
With the following few lines of code, it is possible to apply the K-means clustering algorithms available in the sklearn library, to find a number k of clusters in our data. All we need to specify is the number of clusters we want to find, in this case, we will group the data into k=3 clusters:
from sklearn.cluster import KMeans
kmeans = KMeans(n_clusters = 3, n_init=100)
X["cluster"] = kmeans.fit_predict(X)
The last line in the above code stores the clustering result, namely the id of the cluster assigned to every data instance, in a new attribute named “cluster”.
Time to generate some visualizations of our clusters for analyzing and interpreting them! The following code excerpt is a bit long, but it boils down to generating two data visualizations: the first one shows a scatter plot around two data features -culmen length and flipper length- and the cluster each observation belongs to, and the second visualization shows the actual penguin species each data point belongs to.
plt.figure (figsize=(12, 4.5))
# Visualize the clusters obtained for two of the data attributes: culmen length and flipper length
plt.subplot(121)
plt.plot(X[X["cluster"]==0]["culmen_length_mm"],
X[X["cluster"]==0]["flipper_length_mm"], "mo", label="First cluster")
plt.plot(X[X["cluster"]==1]["culmen_length_mm"],
X[X["cluster"]==1]["flipper_length_mm"], "ro", label="Second cluster")
plt.plot(X[X["cluster"]==2]["culmen_length_mm"],
X[X["cluster"]==2]["flipper_length_mm"], "go", label="Third cluster")
plt.plot(kmeans.cluster_centers_[:,0], kmeans.cluster_centers_[:,2], "kD", label="Cluster centroid")
plt.xlabel("Culmen length (mm)", fontsize=14)
plt.ylabel("Flipper length (mm)", fontsize=14)
plt.legend(fontsize=10)

# Compare against the actual ground-truth class labels (real penguin species)
plt.subplot(122)
plt.plot(X[y==0]["culmen_length_mm"], X[y==0]["flipper_length_mm"], "mo", label="Adelie")
plt.plot(X[y==1]["culmen_length_mm"], X[y==1]["flipper_length_mm"], "ro", label="Chinstrap")
plt.plot(X[y==2]["culmen_length_mm"], X[y==2]["flipper_length_mm"], "go", label="Gentoo")
plt.xlabel("Culmen length (mm)", fontsize=14)
plt.ylabel("Flipper length (mm)", fontsize=14)
plt.legend(fontsize=12)
plt.show
Here are the visualizations:

By observing the clusters we can extract a first piece of insight:
- There is a subtle, yet not very clear separation between data points (penguins) allocated to the different clusters, with some gentle overlap between subgroups found. This does not necessarily lead us to conclude that the clustering results are good or bad yet: we have applied the k-means algorithm on several attributes of the dataset, but this visualization shows how data points across clusters are positioned in terms of two attributes only: ‘culmen length’ and ‘flipper length’. There might be other attribute pairs under which clusters are visually represented as more clearly separated from each other.
This leads to the question: what if we try visualizing our cluster under any other two variables used for training the model?
Let’s try visualizing the penguins’ body mass (grams) and culmen length (mm).
plt.plot(X[X["cluster"]==0]["body_mass_g"],
X[X["cluster"]==0]["culmen_length_mm"], "mo", label="First cluster")
plt.plot(X[X["cluster"]==1]["body_mass_g"],
X[X["cluster"]==1]["culmen_length_mm"], "ro", label="Second cluster")
plt.plot(X[X["cluster"]==2]["body_mass_g"],
X[X["cluster"]==2]["culmen_length_mm"], "go", label="Third cluster")
plt.plot(kmeans.cluster_centers_[:,3], kmeans.cluster_centers_[:,0], "kD", label="Cluster centroid")
plt.xlabel("Body mass (g)", fontsize=14)
plt.ylabel("Culmen length (mm)", fontsize=14)
plt.legend(fontsize=10)
plt.show

This one seems crystal clear! Now we have our data separated into three distinguishable groups. And we can extract additional insights from them by further analyzing our visualization:
- There is a strong relationship between the clusters found and the values of the ‘body mass’ and ‘culmen length’ attributes. From the bottom-left to the top-right corner of the plot, penguins in the first group are characterized by being small due to their low values of ‘body mass’, but they exhibit largely varying bill lengths. Penguins in the second group have medium size and medium to high values of ‘bill length’. Lastly, penguins in the third group are characterized by being larger and having a longer bill.
- It can be also observed that there are a few outliers, i.e. data observations with atypical values far from the majority. This is especially noticeable with the dot at the very top of the visualization area, indicating some observed penguins with an overly long bill across all three groups.
Wrapping Up
This post illustrated the concept and practical application of cluster analysis as the process of finding subgroups of elements with similar characteristics or properties in your data and analyzing these subgroups to extract valuable or actionable insight from them. From marketing to e-commerce to ecology projects, cluster analysis is widely applied in a variety of real-world domains.
Iván Palomares Carrascosa is a leader, writer, speaker, and adviser in AI, machine learning, deep learning & LLMs. He trains and guides others in harnessing AI in the real world.